Please contact us with any questions
This new version of the Economatica system introduces the following improvements to the settings window for columns and graphs:
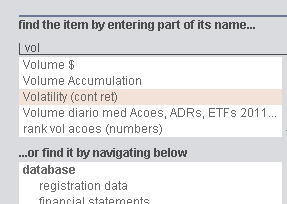
1) Search system: Now you can rely on a search tool to find items to add as columns or on graphs. See the example below in which "Volatility" is searched
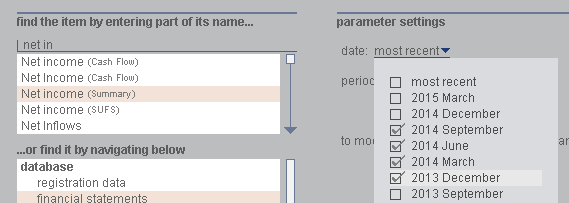
2) Create multiple columns in a single operation: Now you can create columns for a series of dates in one step. See the example below in which Net Income columns for the past 4 quarters are created
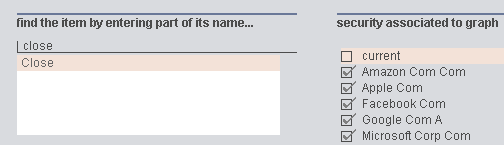
3) Create multiple graphs in a single operation: Now you can create graphs for multiple securities in one step. See the example below in which close price graphs for various securities are created
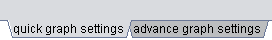
4) Highlighting the most important parameters: The first tab (Quick settings) shows options for the most important parameters only (date, period, etc.). To access the other parameters (currency, legend, etc) you must click on the tab "Advanced settings"